
HOW CAN YOU PREDICT WHAT THE CONDITIONS WILL BE FOR A GIVEN DAY?
That is a challenge that even the scientific community struggles with. However, you can look at trends in current conditions. The I95 only shows what the present conditions are, but as it updates hourly, you can see the way it is trending. You may see many kinds of space weather alerts from various scientific agencies/institutions. Those alerts may be reporting levels of activity that would likely not impact your operations but are provided for scientific applications.
The GNSS Planning Tool linked at the bottom left of our websites (then choose “World View”) gives you a look at the conditions centered around your location (you have to go to ‘My Settings’ in the tool to set your location). Not only can you see the availability of various satellites but also the total electron content (TEC), which gives you an idea of how rough it might be out there. You can’t go forward in time, but you can see the general trend of the iono that would be headed to your region as the world turns and the time-of-day changes. The tool also has an option to “playback” a whole period to see how the conditions progressed.
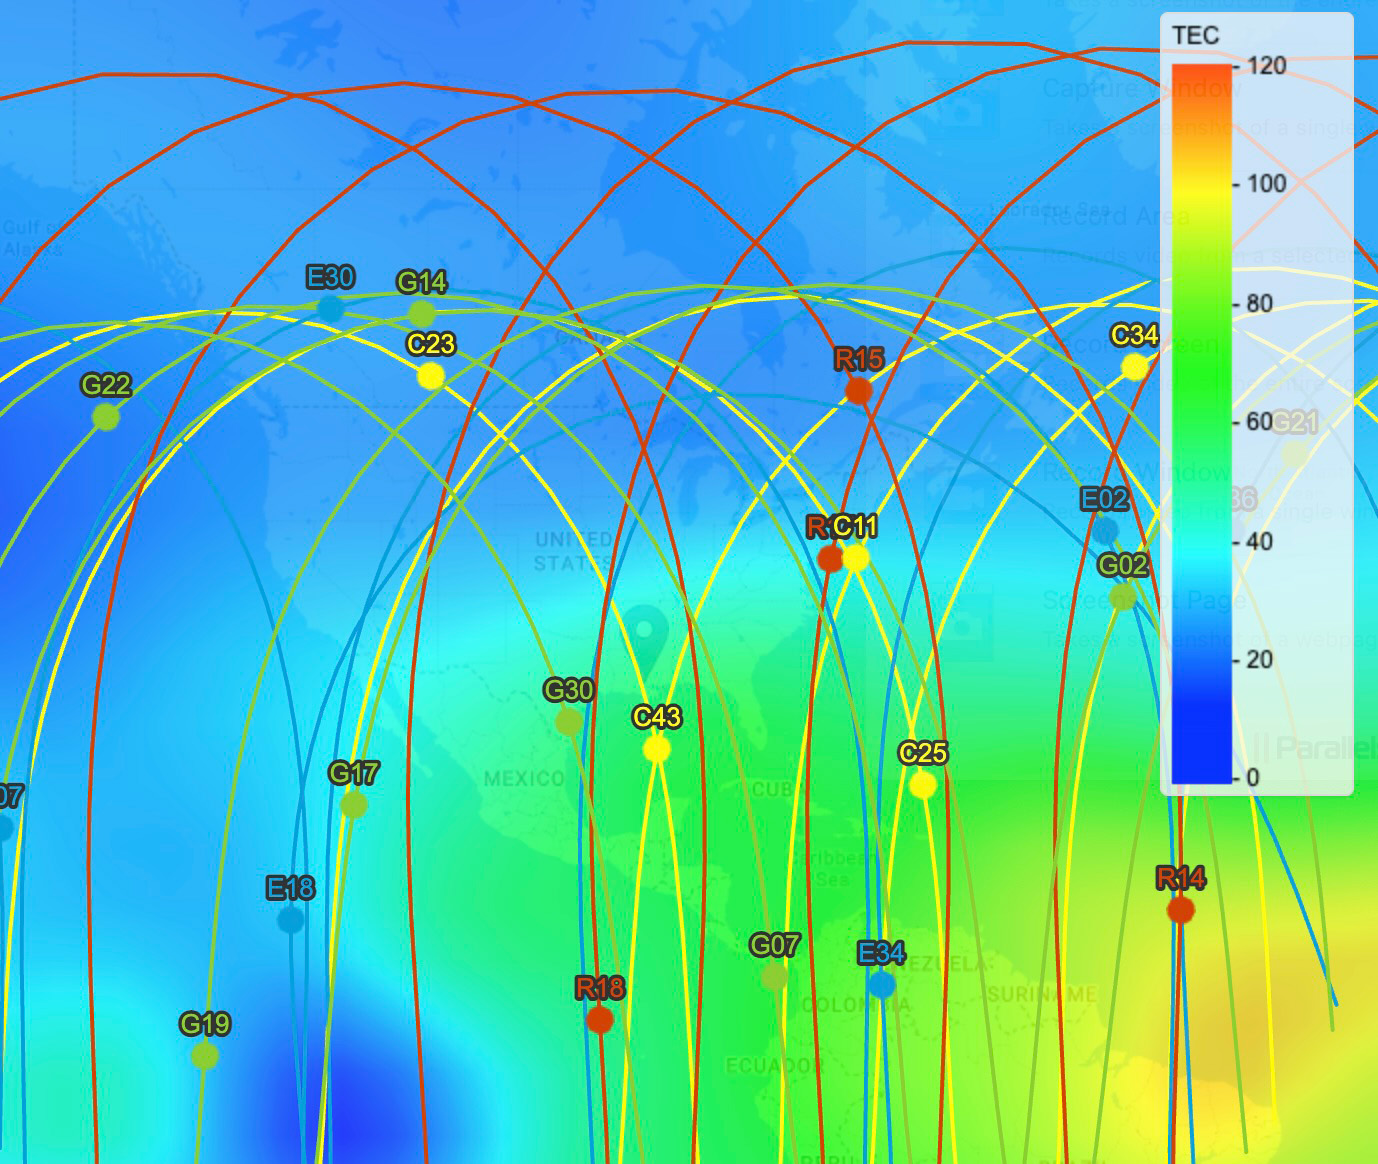
An example TEC map, centered on Western Washington, also showing a snapshot of satellites.
Note that you can also see the ‘Scintillation’ map. During heightened space weather conditions, scintillation can occur more often: acute but often brief events that can cause brief spikes in disruptions. NOAA and others are working on better prediction tools, but for now, you can look at ongoing current daily trends to see what you might expect. There can be increased scintillation at dusk and dawn, and the general Iono peak is usually around midday.
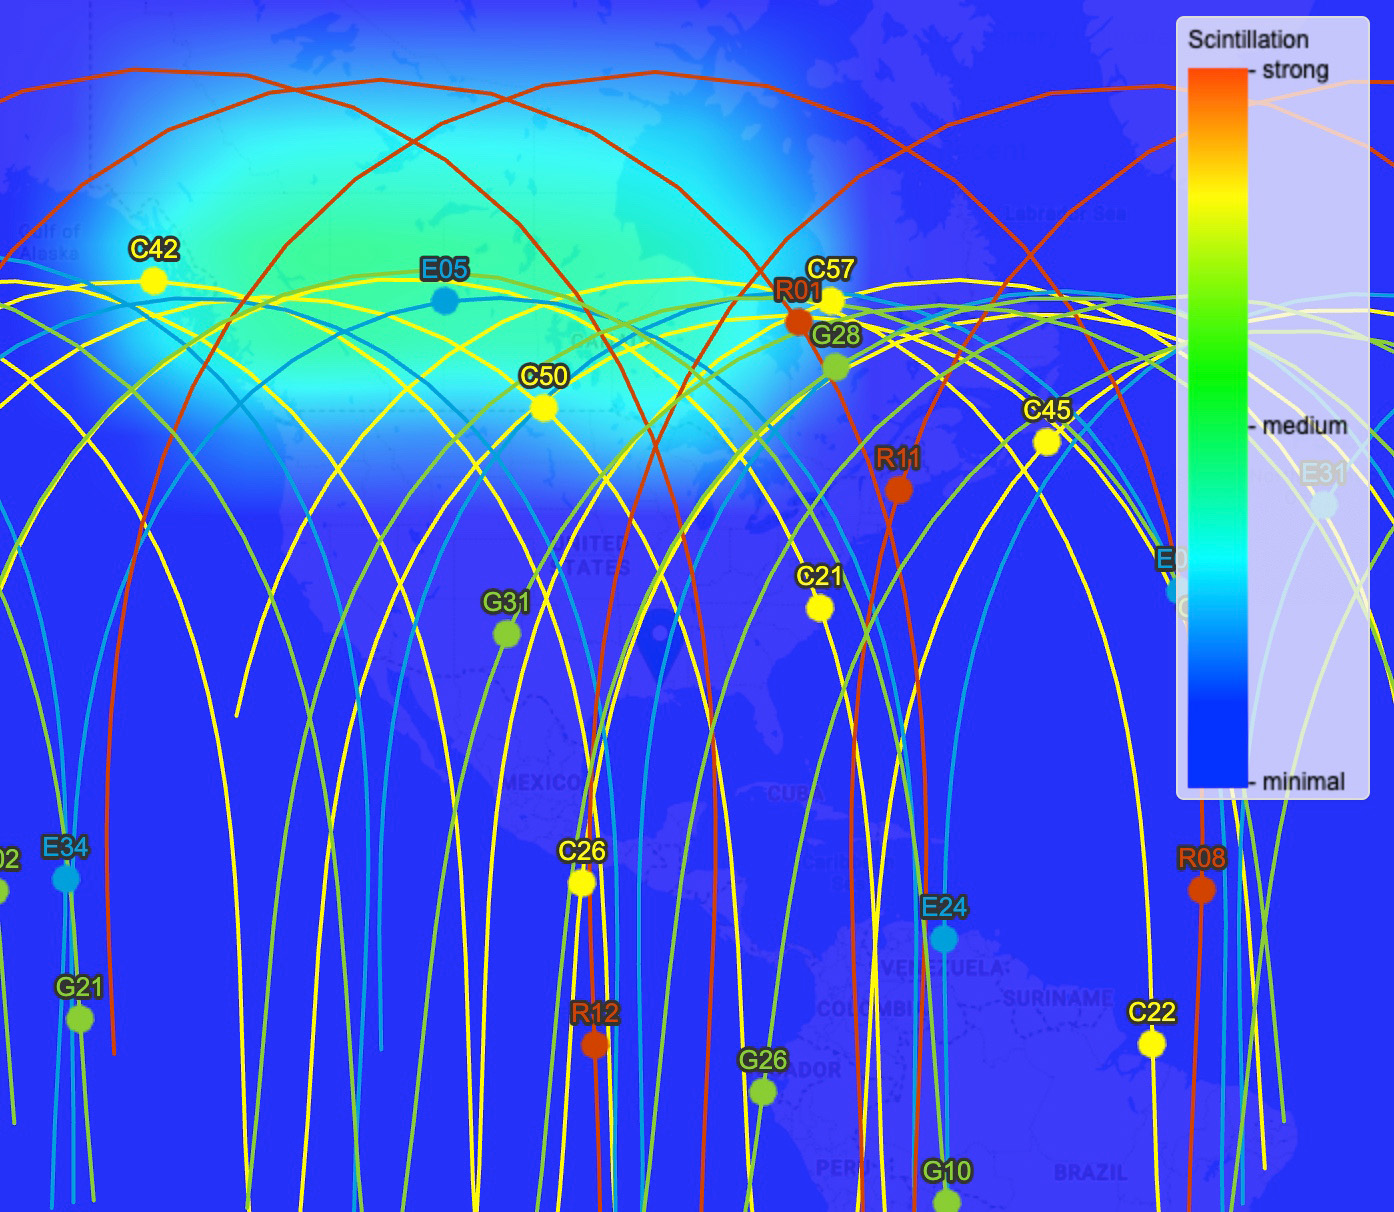
An example scintillation map, centered on Western Washington, also showing a snapshot of satellites.
Note that during this snapshot in time, the observed scintillation is far way in Central America.
No questions yet.