CAN SOLAR STORMS MESS UP MY RESULTS?

Yes. Though relatively rare, please note the solar cycle info below.

Solar Cycle 25.
We are approaching the peak years of the latest solar cycle (the 25th since the phenomenon was tracked), which coincidentally will peak in 2025.
Below is NOAA’s current Solar Cycle Progression:

NOAA’s Space Weather Prediction Center released a revised prediction for solar activity during Solar Cycle 25. The new Experimental Solar Cycle Prediction issued on May 2, 2024 concludes that solar activity will increase more quickly and peak at a higher level than previously predicted The updated prediction calls for Solar Cycle 25 to peak between May and Febuary of 2025, with a maximum sunspot number between 137 and 171. (NOAA)

FORECASTS

SWPC produces forecasts for multiple space weather phenomenon types and the resulting impacts to Earth and human activities.  A variety of products are available that provide these forecast expectations and their respective measurements in formats that range from detailed technical forecast discussions to NOAA Scale values to simple bulletins that give information in layman's terms.

Forecasting is the prediction of future events, based on analysis and modeling of the past and present conditions of the environment you are interested in. In Space Weather, persistence and recurrence of active regions on the sun over the 27-day solar rotational period play an important role in accurately forecasting the space environment.


How can we make it through this cycle with minimal disruption? The good news is that with multi-constellations/signals your field operations may not be as adversely affected as when there was a single constellation. Plus, some manufacturers have released, or are working on software upgrades for newer rovers that can substantially mitigate (all but the most severe) conditions. Users made it through the previous cycle with only spotty disruptions, chances are this one will be the same.


A caveat about single base operations: if you do single base on one day with calm ionospheric conditions, you may get different results than on a day of high ionospheric activity. Network corrections, like VRS are often the better choice, but neither will have much luck if in the red. There are hazards to mixing solutions: If you start a project with one method, you may get different results when switching baseline lengths or on different iono status days.


In short, we could be in for several years where the potential for detrimental space weather effects could be heightened on occasion. However, with today’s modern equipment, you may only experience issues when the values are “in the red”.

No questions yet.

HOW COULD SOLAR STORMS AFFECT FIELD OPERATIONS?

The types of symptoms you could see as a result of increased space weather activity can include:

  • Significantly longer time to obtain fixed carrier phase
  • Fixed navigation solutions with increased predicted precision
  • Float or differential navigation solutions rather than fixed
  • Biased fixed navigation solutions due to bad ambiguity

Combinations of the above can lead to reduced productivity.

No questions yet.

HOW CAN I TELL IF POOR ROVER SYMPTOMS ARE DUE TO SPACE WEATHER ISSUES?

Your issues may be due to other factors, but you can see the current space weather status to help troubleshoot. Like many RTNs, our network tracks the effects of ionospheric activity with data from our own sensors. To see the status (for the current day or past days), log into either of our websites and choose the ‘I95 Ionosphere option in the upper left’. The I95 is a common index (Wanninger) that has been adapted for the I95 index on our network. The value is calculated for each subnet; it is one value. The higher it is, the more likely a rover will be impacted by ionospheric disturbances.

The rule of thumb for interpreting the I95 (as adapted for our network) is:

  • Below 2 (below green): Very low activity, no impact
  • Between 2 and 4 (between green and yellow): Normal activity, very little impact
  • Between 4 and 8 (between yellow and red): Increased Impact can be noticeable (e.g., longer initialization times for the rover)
  • Above 8 (above red): High Impact very likely noticeable (e.g., potentially no rover fixes at all)

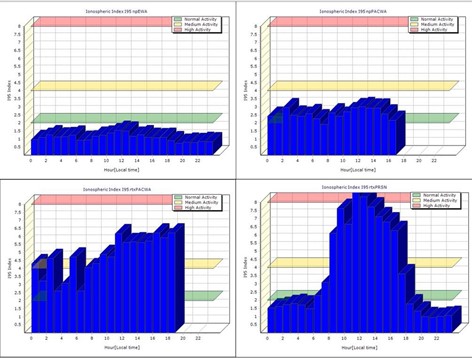
Examples of I95 plots from different subnets on different days. Clockwise from upper left: Below 2 (very low activity), Between 2-4 (normal activity), Between 4-8 (increased activity (noticeable effects), Some periods above 8 (possibly no fixes).


IRIM/GRIM graphs
Another set of plots can help estimate what the positional errors might be due to space weather conditions. Values show the "predicted remaining error" and indicate the estimated impact you could expect in a rover measurement. This is the error that remains that cannot be completely modeled out. IRIM/GRIM can be calculated for the whole network or for individual stations. The network value is the average of the individual stations in a subnet. The method works in a way that, e.g., network software takes the whole subnet, takes out one station, and sees how the Iono model fits to the actual observations on that station. The part that does not fit is represented by IRIM. GRIM shows the remaining error with respect to the coordinate. In the example below, during a heightened space weather period, you may have 18mm of IRIM error (left), and 9mm of GRIM error (right) remaining. Of course, the conditions for where you are may vary, but these plots can be a good indicator of expected results.

Typically, you will do better than the plots indicate, as they are looking at a whole subnet.

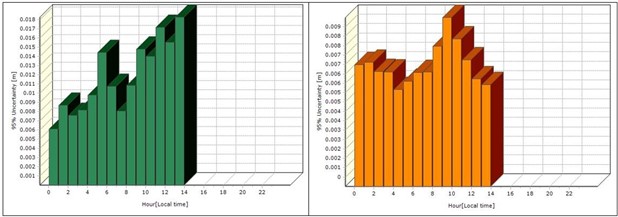
Examples are the IRIM plot (left) and GRIM plot (right).

Note that if you can fix (even under high conditions), you are probably OK, but keep an eye on your residuals. Only when it goes into the red for several hours would you see enough degradation to consider using non-GNSS methods. In our 20+ years of operations, we have only experienced a handful of days when GNSS field operations were not recommended, but often only for a part of those days. If you have a handheld recreational GPS unit and it is having trouble getting a position, that can confirm that the current conditions will not be good for your rover.

No questions yet.

HOW CAN YOU PREDICT WHAT THE CONDITIONS WILL BE FOR A GIVEN DAY?

That is a challenge that even the scientific community struggles with. However, you can look at trends in current conditions. The I95 only shows what the present conditions are, but as it updates hourly, you can see the way it is trending. You may see many kinds of space weather alerts from various scientific agencies/institutions. Those alerts may be reporting levels of activity that would likely not impact your operations but are provided for scientific applications.


The GNSS Planning Tool linked at the bottom left of our websites (then choose “World View”) gives you a look at the conditions centered around your location (you have to go to ‘My Settings’ in the tool to set your location). Not only can you see the availability of various satellites but also the total electron content (TEC), which gives you an idea of how rough it might be out there. You can’t go forward in time, but you can see the general trend of the iono that would be headed to your region as the world turns and the time-of-day changes. The tool also has an option to “playback” a whole period to see how the conditions progressed.

An example TEC map, centered on Western Washington, also showing a snapshot of satellites.


Note that you can also see the ‘Scintillation’ map. During heightened space weather conditions, scintillation can occur more often: acute but often brief events that can cause brief spikes in disruptions. NOAA and others are working on better prediction tools, but for now, you can look at ongoing current daily trends to see what you might expect. There can be increased scintillation at dusk and dawn, and the general Iono peak is usually around midday.


An example scintillation map, centered on Western Washington, also showing a snapshot of satellites.

Note that during this snapshot in time, the observed scintillation is far way in Central America.


No questions yet.

HOW CAN WE MAKE IT THROUGH THIS SOLAR CYCLE WITH MINIMAL DISRUPTION?

The good news is that with multi-constellations/signals, your field operations may not be as adversely affected as when there was a single constellation. Plus, some manufacturers have released or are working on software upgrades for newer rovers that can substantially mitigate (all but the most severe) conditions. Users made it through the previous cycle with only spotty disruptions; chances are this one will be the same.

A caveat about single base operations: if you do single base on one day with calm ionospheric conditions, you may get different results than on a day of high ionospheric activity. Network corrections, like VRS are often the better choice, but neither will have much luck if in the red. There are hazards to mixing solutions: If you start a project with one method, you may get different results when switching baseline lengths or on different iono status days.

In short, we could be in for several years where the potential for detrimental space weather effects could be heightened occasionally. However, with today’s modern equipment, you may only experience issues when the values are “in the red.”

No questions yet.